1. The User Ecosystem: A Long-Tail Distribution
Analysis of user segments reveals the fundamental structure of Yelp's user ecosystem and engagement patterns.
User Ecosystem Analysis
Finding
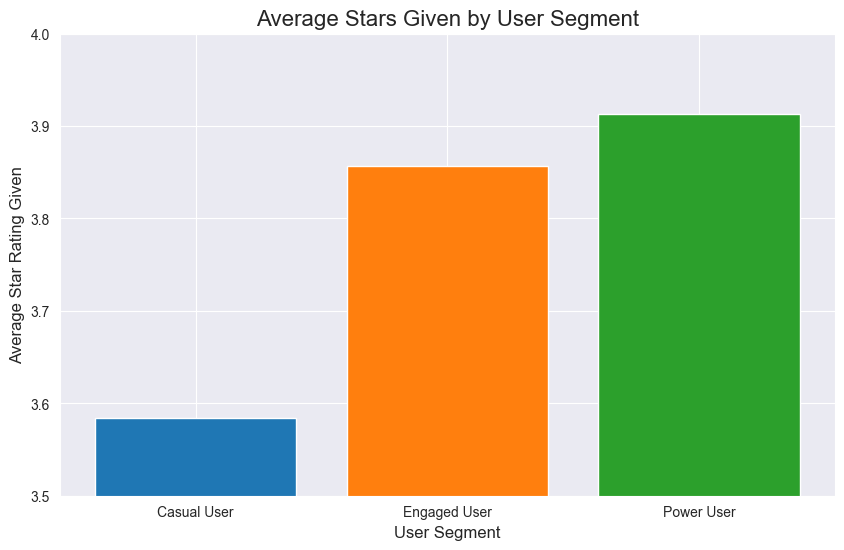
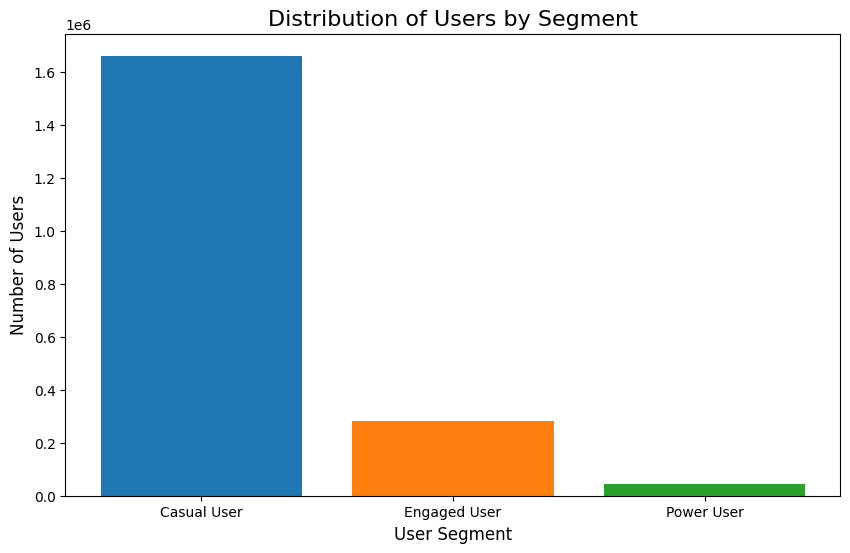
An analysis of user segments reveals a classic power-law distribution. The platform is built on a foundation of over 1.6 million "Casual Users." This group is vastly larger than the more active segments of approximately 280,000 "Engaged Users" and the highly dedicated 40,000 "Power Users."
Strategic Takeaway for Yelp
The platform's health and content volume are fundamentally dependent on the casual majority. The product's review submission process must be frictionless and highly intuitive to maximize conversion from this group.
Strategic Imperative
Build features that gently nudge Casual Users toward becoming Engaged Users, such as personalized prompts, simple milestone badges, or gamified "local expert" challenges.