Back to All Projects

Yelp Dataset Analysis: Key Findings and Insights

This report summarizes the major findings from the analysis of the Yelp Academic Dataset. The goal was to explore the characteristics of businesses, understand user behavior, and identify key trends that could inform business strategy. The analysis was conducted using SQL queries on a PostgreSQL database and visualized using Matplotlib.

Python PostgreSQL EDA Data Viz

Technology Stack

Python 3 Pandas NumPy PostgreSQL SQL Matplotlib Seaborn Plotly Jupyter Git/GitHub

Methodology

Data Source

Analysis conducted using the comprehensive Yelp Open Dataset, a subset of Yelp data intended for educational use. The dataset provides real-world data related to businesses including reviews, photos, check-ins, and attributes. This publicly available dataset contains 6,990,280 reviews across 150,346 businesses in 11 metropolitan areas, distributed in JSON format under educational licensing.

  1. Data Collection: Utilized Yelp Open Dataset JSON files containing comprehensive business information, user reviews, check-ins, and user profile data across multiple metropolitan areas.
  2. ETL Pipeline: Processed JSON data to handle missing values, standardize categorical variables, and create analytical datasets for user segmentation and business performance analysis.
  3. User Segmentation Analysis: Classified users into engagement tiers (Casual, Engaged, Power Users) based on review activity, elite status, and platform interaction patterns.
  4. Business Performance Analysis: Analyzed review patterns, rating distributions, and check-in behaviors to understand market dynamics and user engagement trends.
  5. Temporal Analysis: Examined time-series data to identify seasonal patterns, weekly rhythms, and longitudinal trends in user behavior and content contribution.

2. Hypotheses

Before conducting the analysis, several hypotheses were formulated to guide the investigation:

3. Key Findings and Visualizations

This section details the results of each of the nine distinct analyses performed.

1. The User Ecosystem: A Long-Tail Distribution

Analysis of user segments reveals the fundamental structure of Yelp's user ecosystem and engagement patterns.
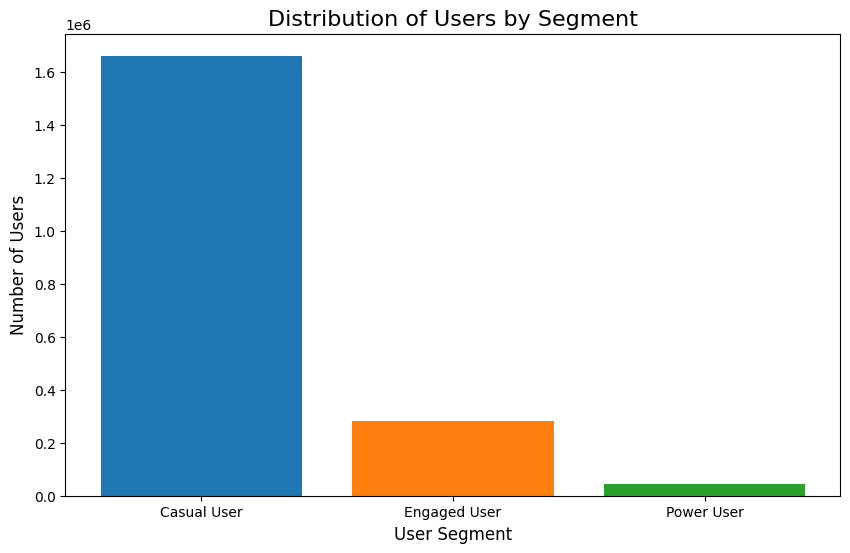
Distribution of User Segments
Figure 1: Long-tail engagement distribution.

User Ecosystem Analysis

Finding

An analysis of user segments reveals a classic power-law distribution. The platform is built on a foundation of over 1.6 million "Casual Users." This group is vastly larger than the more active segments of approximately 280,000 "Engaged Users" and the highly dedicated 40,000 "Power Users."

Casual Users
1.6M+
foundation majority
Engaged Users
280K
active segment
Power Users
40K
highly dedicated

Strategic Takeaway for Yelp

The platform's health and content volume are fundamentally dependent on the casual majority. The product's review submission process must be frictionless and highly intuitive to maximize conversion from this group.

Strategic Imperative

Build features that gently nudge Casual Users toward becoming Engaged Users, such as personalized prompts, simple milestone badges, or gamified "local expert" challenges.
2. Rating Psychology: Engaged Users Are More Generous

Comparative analysis of rating behavior across different user engagement segments.

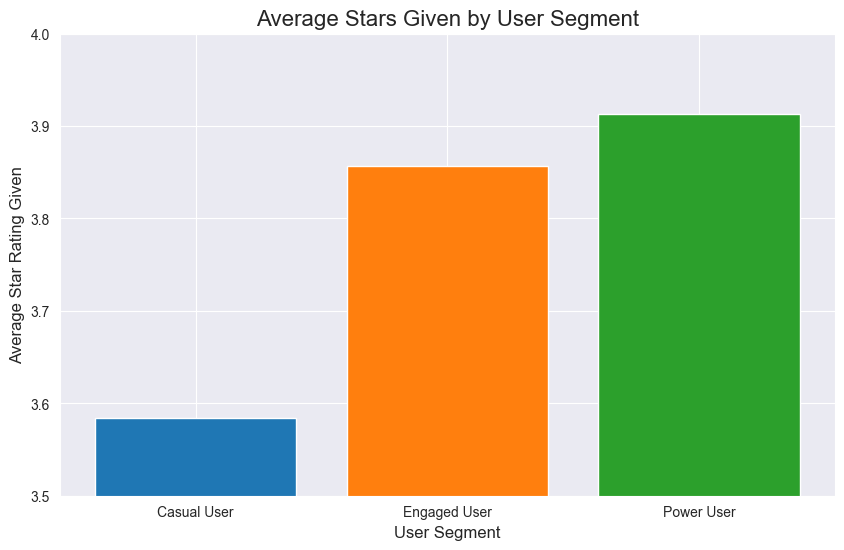
Average stars given by user segment
Figure 2: Rating tendencies across engagement tiers.

Rating Psychology Analysis

Finding

Contrary to the belief that experienced users are harsher critics, the data shows the opposite. "Power Users" award the highest average rating at 3.91 stars, followed by "Engaged Users" at 3.86 stars. "Casual Users" give the lowest average rating at 3.58 stars.

Power Users
3.91
highest average rating
Engaged Users
3.86
moderate advocacy
Casual Users
3.58
most critical

Strategic Takeaway for Yelp

This is a powerful insight for the "Yelp for Business" sales narrative. I can arm sales teams with data showing that the most active and influential users are advocates, not antagonists.

Product Implications

The ratings from more tenured users are not only more descriptive but also more positive, justifying algorithmic weighting that prioritizes their reviews.

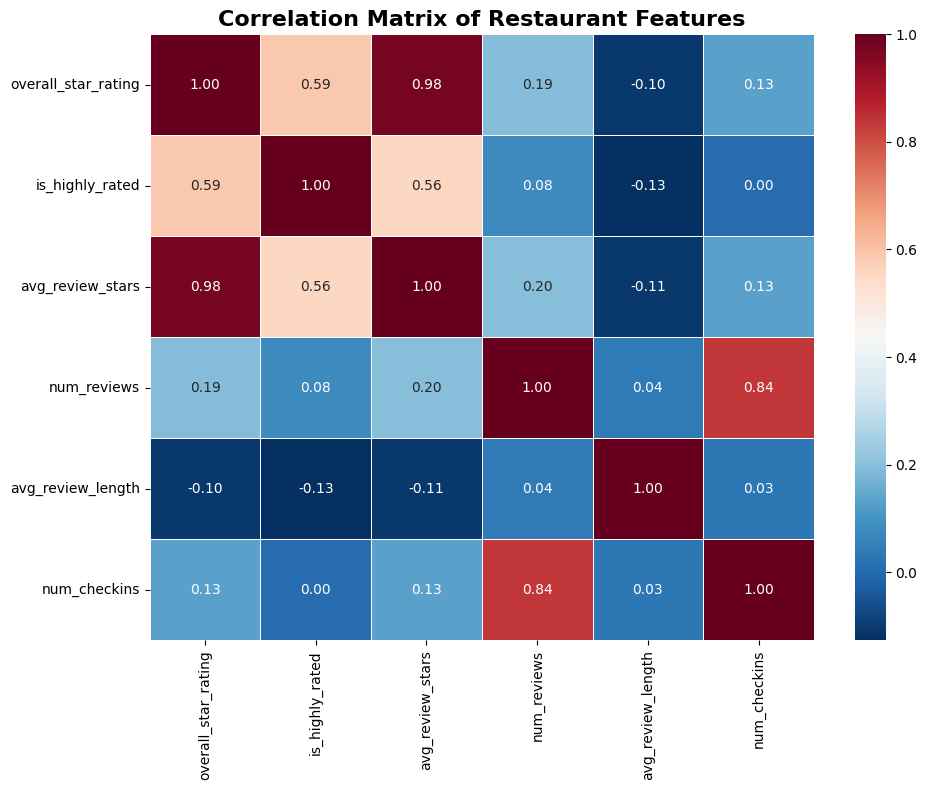
3. The Correlation Engine: Check-ins Drive Reviews

Correlation analysis revealing the relationship between check-ins, reviews, and business quality metrics.

Correlation matrix of restaurant features
Figure 3: Feature correlation heatmap revealing check-in dynamics.

Correlation Engine Analysis

Finding

The correlation matrix definitively proves that popularity (number of reviews) has a negligible link to high quality, with a correlation of just 0.08 between num_reviews and is_highly_rated. The most powerful relationship uncovered is the 0.84 correlation between num_checkins and num_reviews. This indicates that the physical act of a check-in is a primary catalyst for a review.

Popularity ≠ Quality
0.08
reviews vs high rating
Check-ins → Reviews
0.84
strongest correlation
Review Catalyst
Check-in
primary driver

Strategic Takeaway for Yelp

This finding should directly influence product development. I must capitalize on the moment of check-in.

Implementation Strategy

Deploy a push notification timed 30-60 minutes after a user's check-in, asking, "How was your visit to [Business Name]?" This simple, timely prompt could significantly increase the volume and freshness of reviews on the platform.

4. The Weekly Business Rhythm: The Weekend Explosion

Analysis of customer traffic patterns revealing dramatic weekly engagement cycles.

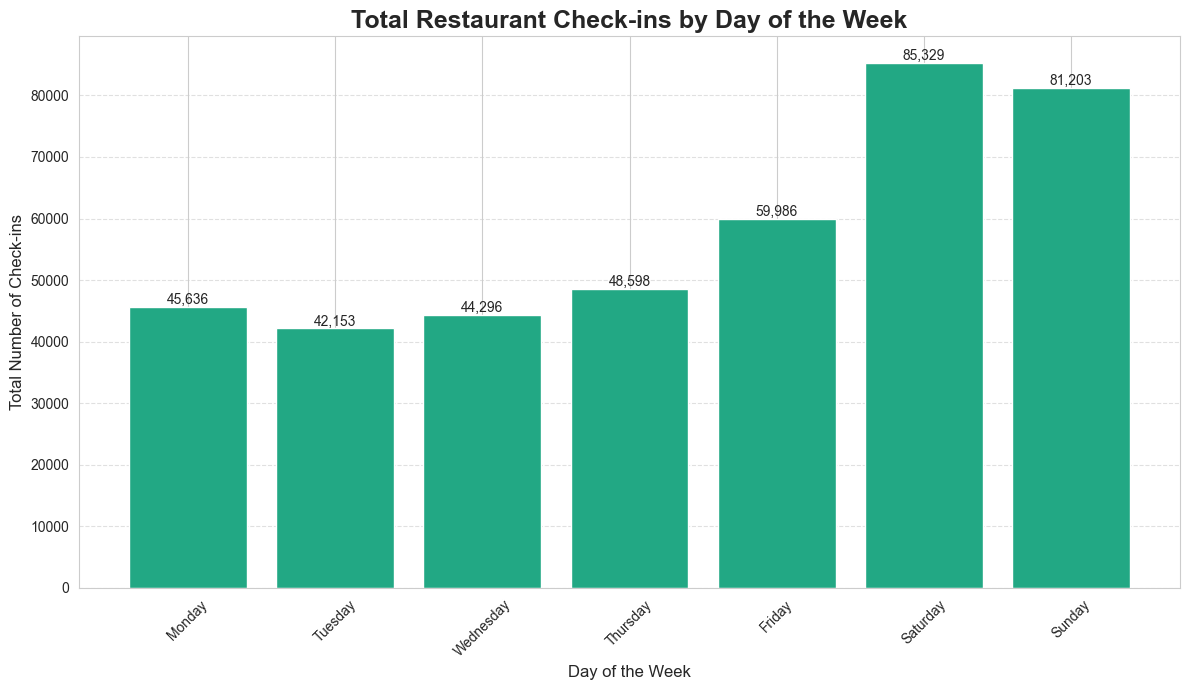
Total restaurant check-ins by day of week
Figure 4: Weekly traffic distribution; weekend surge.

Weekly Business Rhythm Analysis

Finding

Customer traffic, measured by check-ins, follows a predictable and dramatic weekly arc. The week bottoms out on Tuesday with 42,153 check-ins. Activity then builds toward the weekend, exploding on Saturday to a peak of 85,329 check-ins—more than double the traffic of the slowest day. Sunday remains exceptionally high at 81,203 check-ins.

Tuesday Low
42,153
weekly minimum
Saturday Peak
85,329
weekend explosion
Traffic Multiplier
2x
weekend vs weekday

Strategic Takeaway for Yelp

This data is the foundation for a tiered advertising product. I can offer businesses targeted ad packages to "Win the Weekend" or "Boost Your Mid-Week."

Weekend Products

Create "Friday Night Hotlist" curated content to align with peak engagement

Mid-Week Boost

Launch "Tuesday's Top Deals" to stimulate low-traffic day engagement

5. Market Leaders: Identifying Power Partners

Analysis of top-performing businesses to identify strategic partnership opportunities.

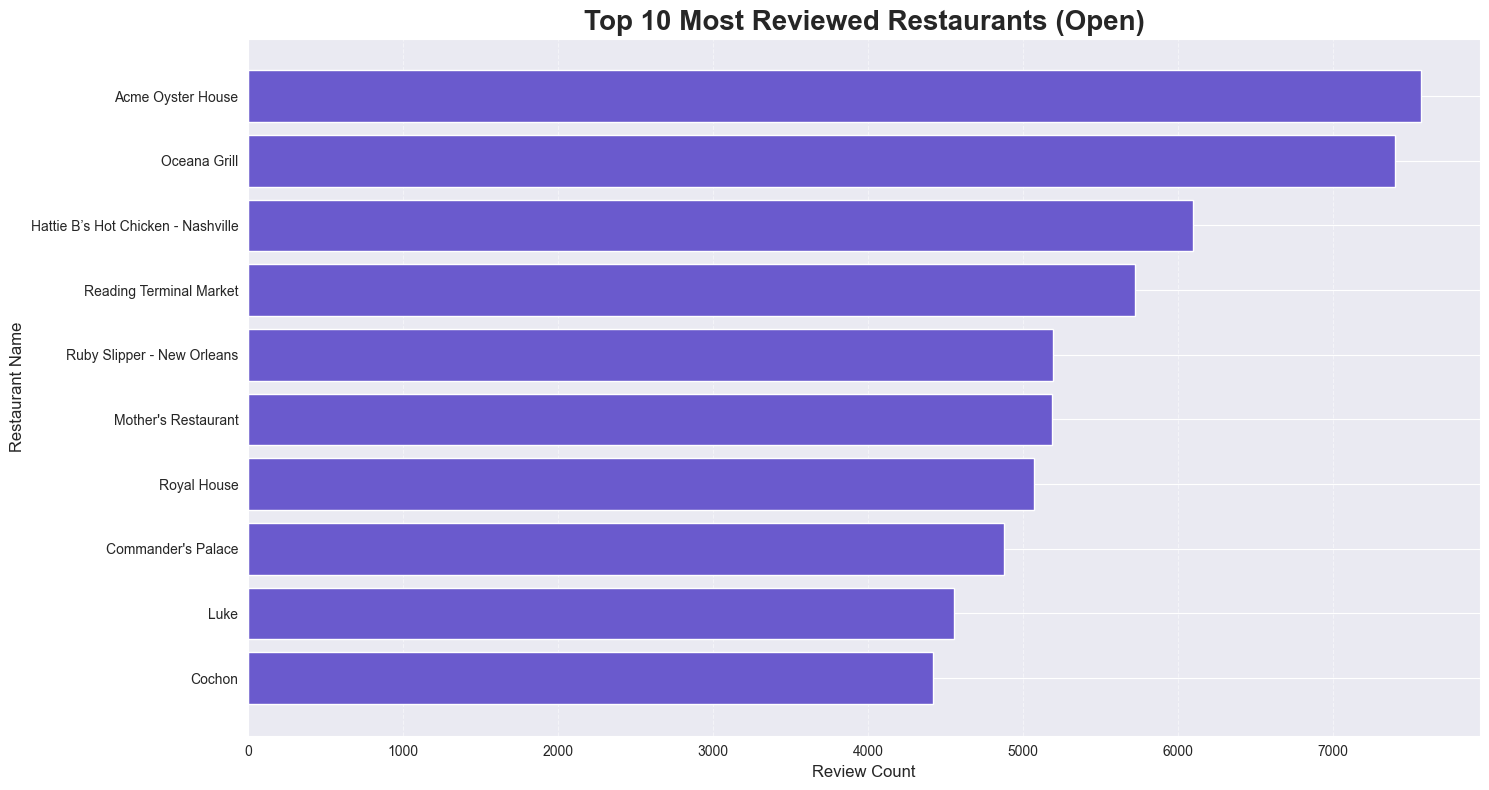
Top 10 most reviewed American restaurants
Figure 5: Concentration of review volume among top venues.

Market Leaders Analysis

Finding

The most-reviewed businesses, such as Acme Oyster House and Oceana Grill (both with over 7,500 reviews), are concentrated in high-traffic, often tourist-centric, urban locations. These are not just businesses; they are anchor institutions on our platform.

Top Performers
7,500+
reviews each
Location Type
Tourist
high-traffic urban
Platform Role
Anchor
institutions

Strategic Takeaway for Yelp

These top-tier businesses should be managed as strategic partners. They are ideal candidates for pilot programs for new premium features, co-marketing campaigns, and compelling case studies.

Partnership Strategy

Co-marketing campaigns ("As Seen on Yelp's Top 10") and premium feature pilot programs

Account Management

Dedicated enterprise account management team for these leaders could yield significant returns

6. Market Opportunity Mapping: Beyond Saturation

Strategic market analysis revealing optimal cities for business expansion beyond traditional saturation metrics.

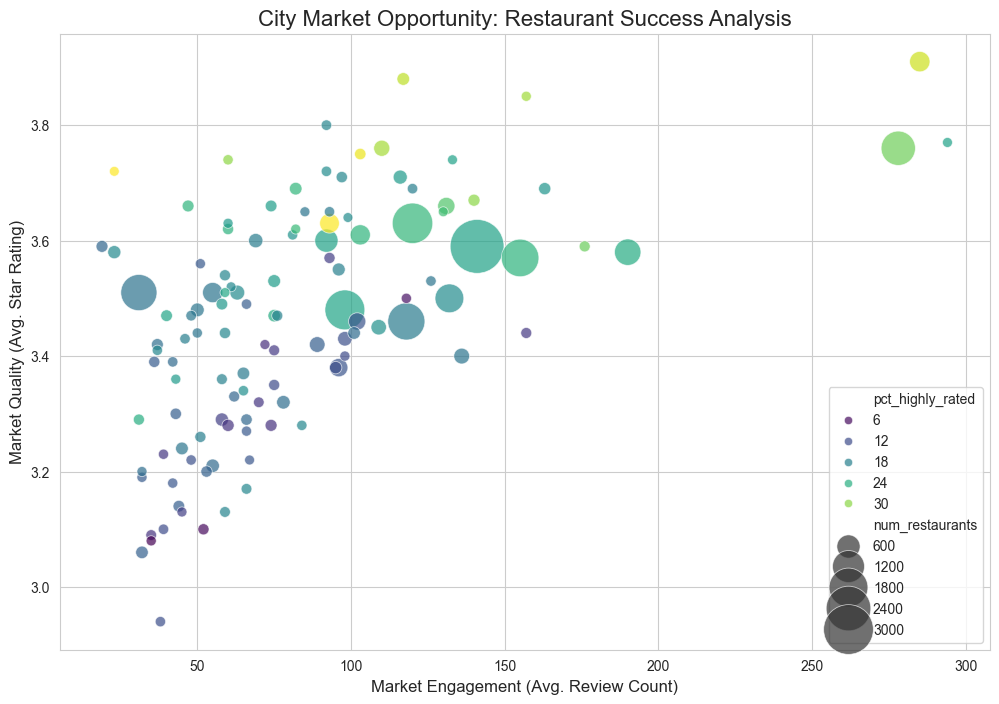
City market opportunity positioning
Figure 6: Opportunity quadrant (engagement vs quality).

Market Opportunity Mapping Analysis

Finding

The scatter plot analysis reveals that the best markets for new businesses are not the most saturated ones. The ideal opportunity lies in cities with high market quality (avg. rating) and high market engagement (avg. reviews). Philadelphia exemplifies this "sweet spot," indicating a mature market that actively rewards quality.

Sweet Spot Leader
Philadelphia
optimal market
Market Quality
High
avg. rating
Engagement
High
avg. reviews

Strategic Takeaway for Yelp

This analysis is a business development tool. Sales teams can use this data to prioritize outreach in high-potential cities.

Sales Strategy

Use data to prioritize outreach in high-potential cities for business acquisition

Marketing Focus

Launch hyper-targeted campaigns in "sweet spot" markets to accelerate growth

7. Niche Domination: Owning the Nightlife Category

Category-specific analysis revealing opportunities for vertical market leadership.

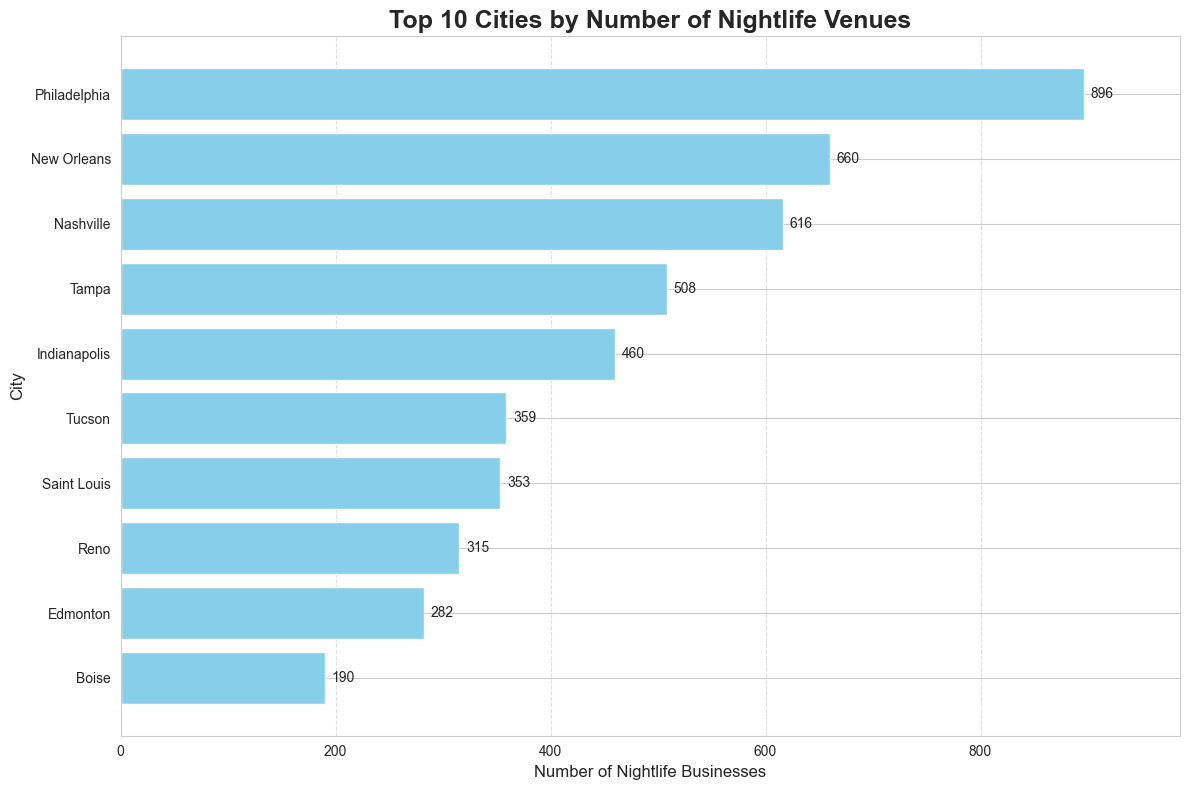
Top cities by number of nightlife venues
Figure 7: Nightlife venue distribution.

Niche Domination Analysis

Finding

In the "Nightlife" category, Philadelphia is the undisputed leader with 896 venues, over 35% more than the runner-up, New Orleans (660). This quantitative dominance establishes Philadelphia as the premier nightlife city within the dataset.

Philadelphia
896
nightlife venues
New Orleans
660
runner-up
Dominance
35%
market lead

Strategic Takeaway for Yelp

Yelp should move to "own" the nightlife vertical in Philadelphia. This means creating dedicated marketing campaigns, editorial content, and partnerships with local nightlife bloggers.

Content Strategy

Create "The Yelp Guide to Philly Nightlife" editorial content

Brand Halo

Solidify authority in key category to create powerful brand halo effect

8. Elite vs. Non-Elite: The Nuanced vs. The Decisive

Comparative analysis of rating behavior between Elite Squad members and regular users.

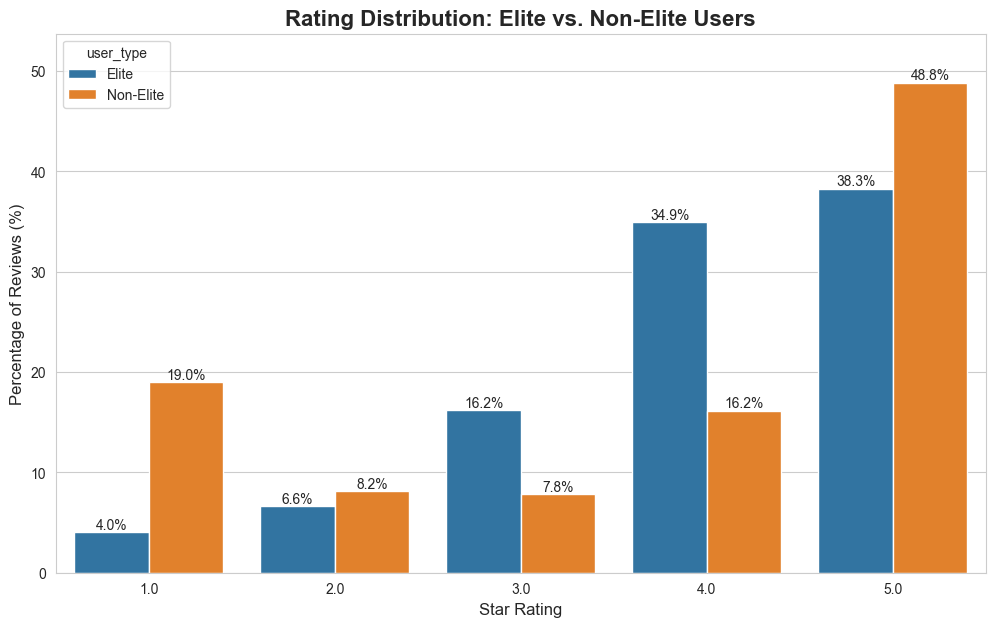
Rating distribution elite vs non-elite
Figure 8: Distribution profile comparison.

Elite vs. Non-Elite Analysis

Finding

Non-Elite users are far more decisive and extreme in their ratings, with 48.8% of their reviews being 5-stars. Elite users are more measured and nuanced, distributing their ratings more evenly across 3-stars (16.2%), 4-stars (34.9%), and 5-stars (38.3%). They act as discerning critics rather than just fans or detractors.

Non-Elite 5-Stars
48.8%
decisive extremes
Elite 4-Stars
34.9%
nuanced preference
Elite 5-Stars
38.3%
measured praise

Strategic Takeaway for Yelp

This informs how I present review content. I can educate businesses that Elite reviews offer invaluable constructive feedback for operational improvements.

Business Education

Elite reviews offer constructive feedback for operational improvements

Product Enhancement

Surface reviews with high "detail" or "nuance" scores more prominently

9. The Shifting Tides: The Decline of Elite Content Share

Temporal analysis revealing the changing dynamics of Elite user influence on platform content.

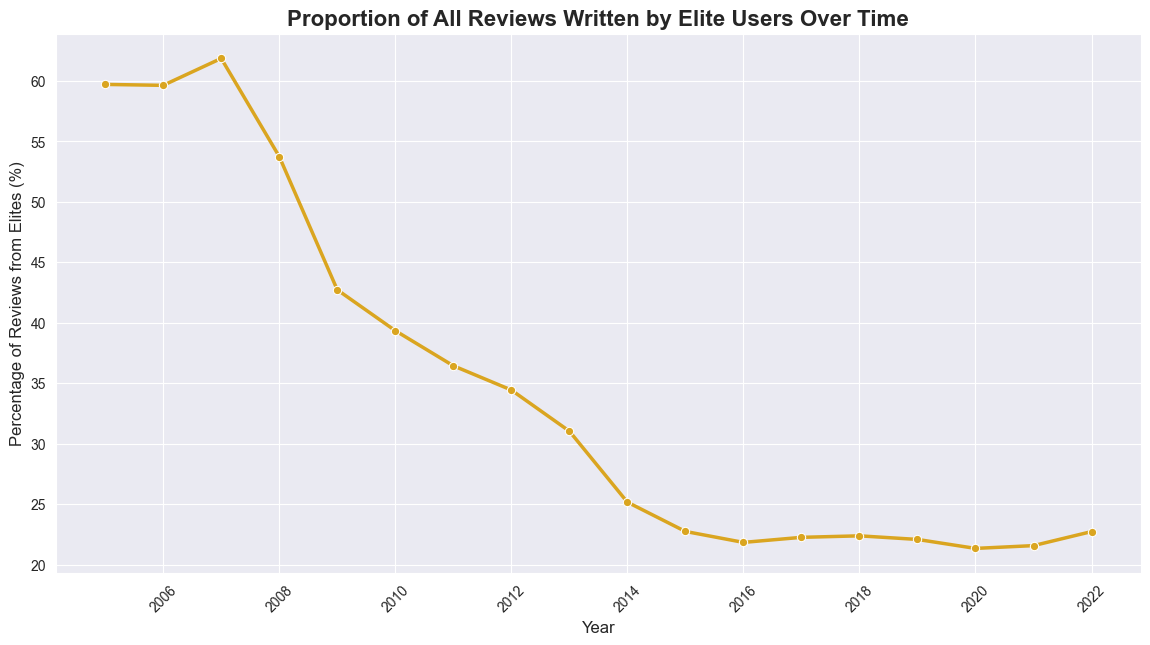
Elite user contribution over time
Figure 9: Declining elite share trend.

Elite Content Share Analysis

Finding

The proportion of reviews written by Elite users has been in a long-term, steady decline. After peaking at over 60% of all reviews around 2007, their contribution has fallen to just over 20% by 2022. The voice of the "everyday user" is now, by volume, the dominant force on the platform.

2007 Peak
60%
elite review share
2022 Share
20%
current elite contribution
Trend
Declining
steady decline

Strategic Takeaway for Yelp

This is a critical insight into the platform's evolution. While the Elite program remains a valuable community asset, I must recognize that future content growth depends on the broader user base.

Strategic Imperative

Develop new programs and product features that identify, reward, and cultivate the next generation of high-quality, non-Elite contributors to ensure the long-term health and vitality of the content ecosystem.

4. Limitations of the Analysis

5. Conclusion and Future Work

This project successfully validated our initial hypotheses and yielded key insights into the Yelp ecosystem. By systematically analyzing business attributes, user segments, market dynamics, and operational rhythms, we have painted a data-driven picture of the restaurant industry.

Future Work could include:

Explore the Code

Full notebooks, SQL extraction scripts & transformation workflow are available in the repository.

View on GitHub
Back to All Projects