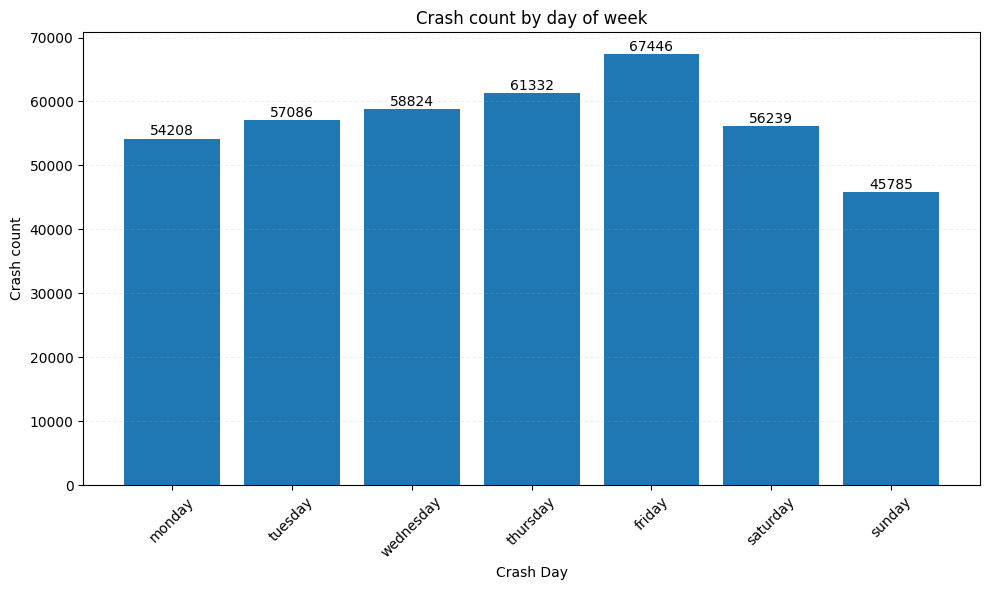
1. Crashes by Day of Week
Friday highest (67,446) vs Sunday (45,785) → 47% differential guiding enforcement.
Temporal, spatial & severity dynamics of reported crashes across Queensland (2001–2024) highlighting peak risk periods & environmental drivers.
Interactive road crash analysis dashboard (Power BI)
Friday highest (67,446) vs Sunday (45,785) → 47% differential guiding enforcement.
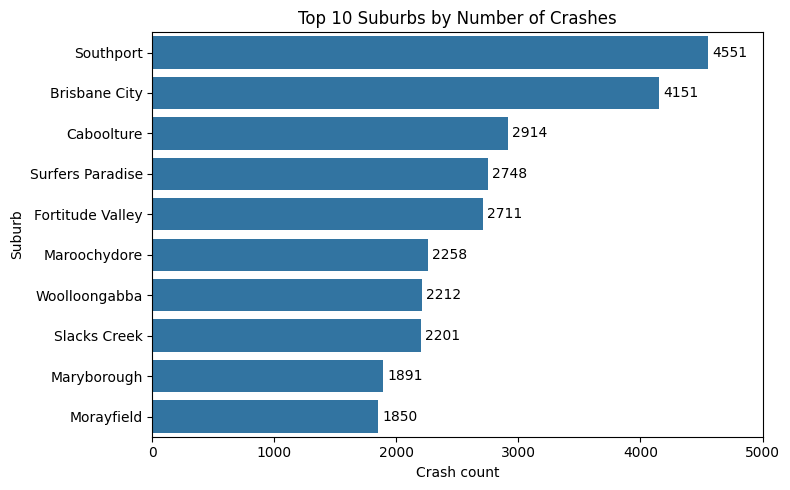
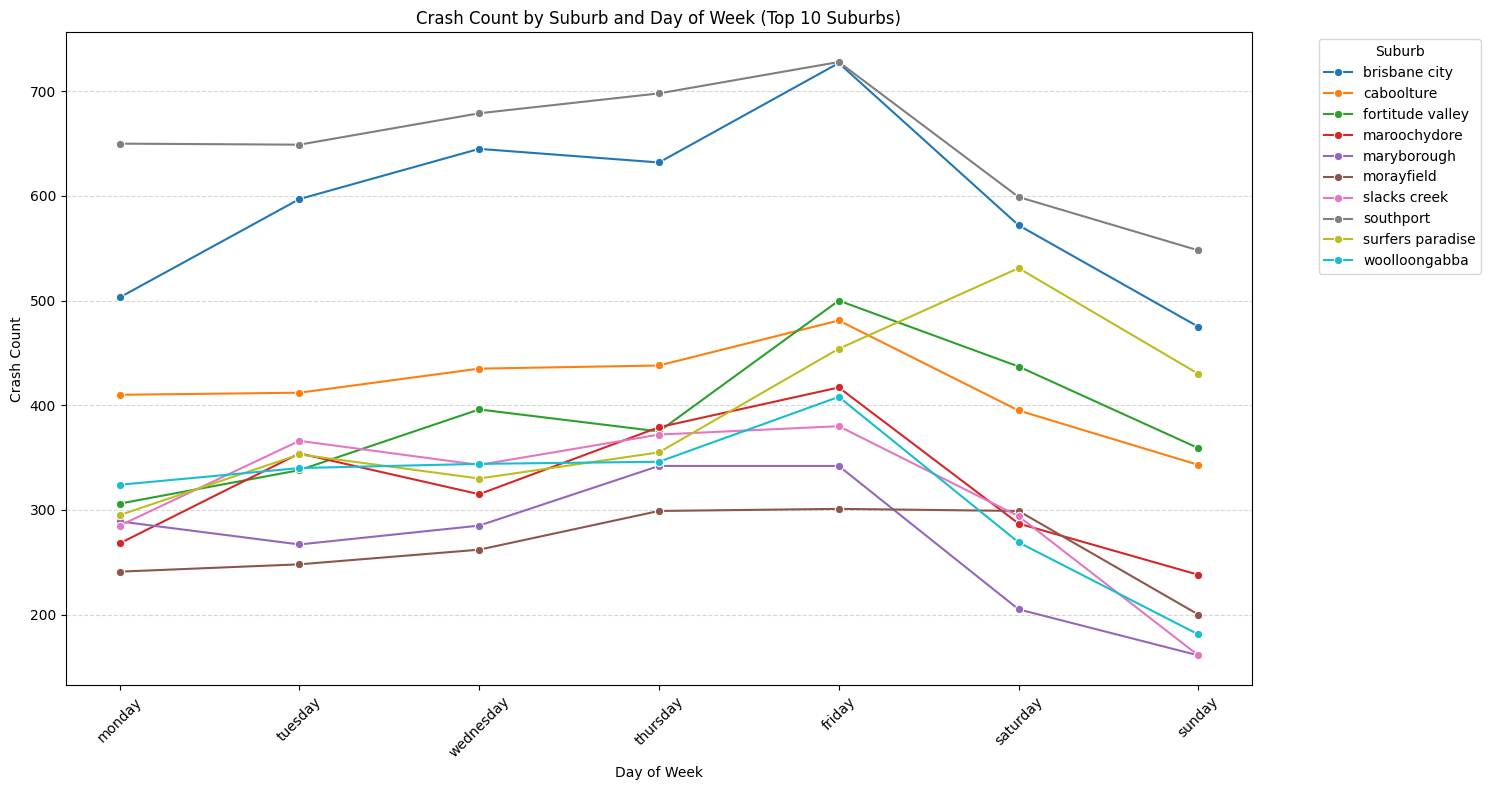
Southport & Brisbane City dominate → focus mitigations in top decile suburbs.
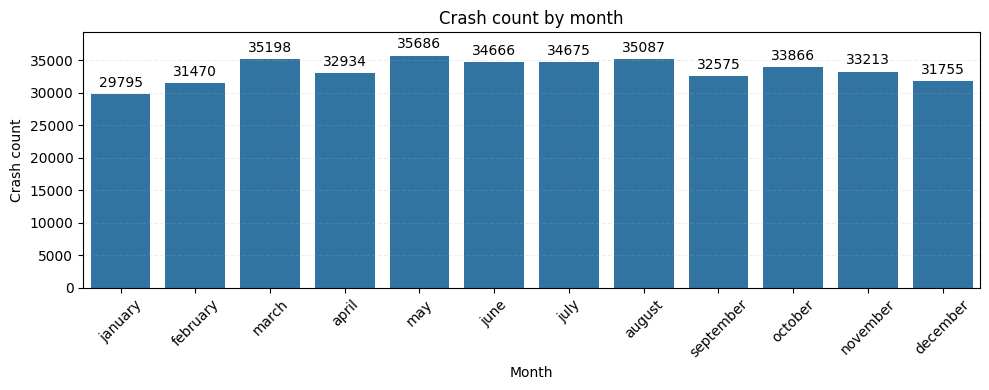
March peak vs January trough (~20% lower) → seasonal campaign timing.
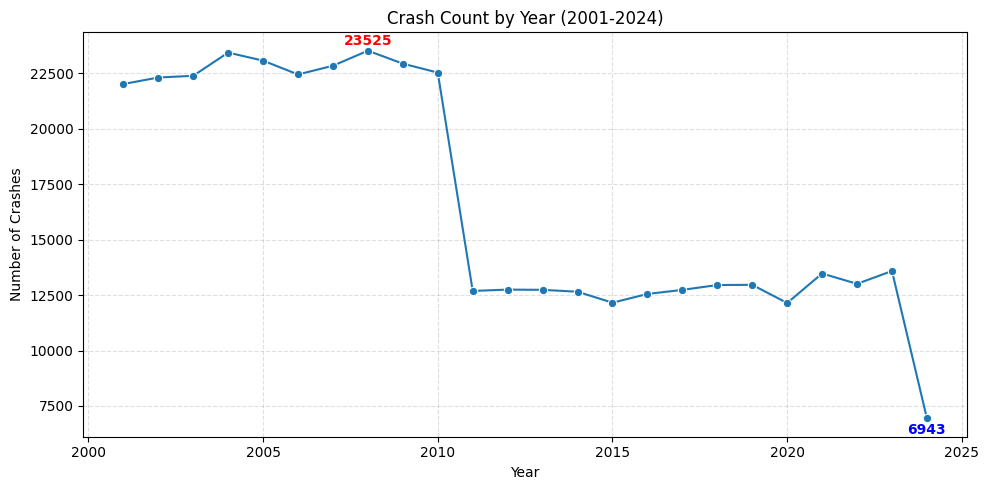
2011 peak (23,525) → 2024 (6,943) ~70% decline; monitor plateau risk.
Peak 15:00–18:00 weekdays; Friday 17:00 highest → fatigue + congestion.
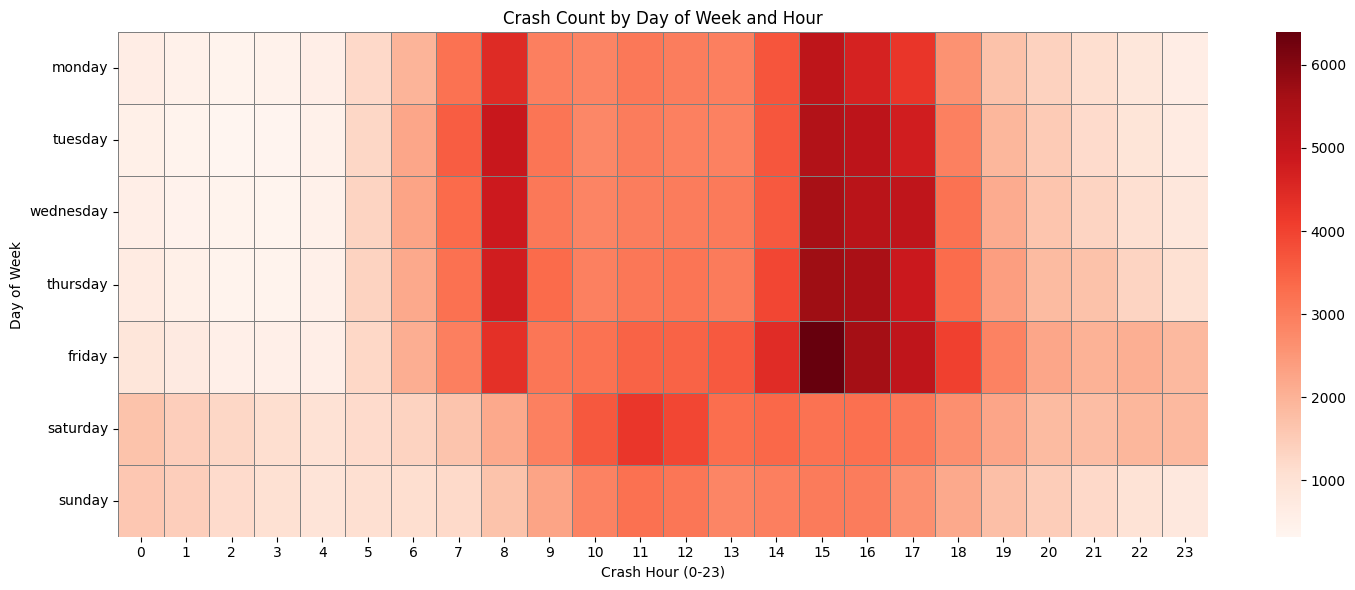
Commercial districts show sharper Friday spikes → local signal/patrol tuning.
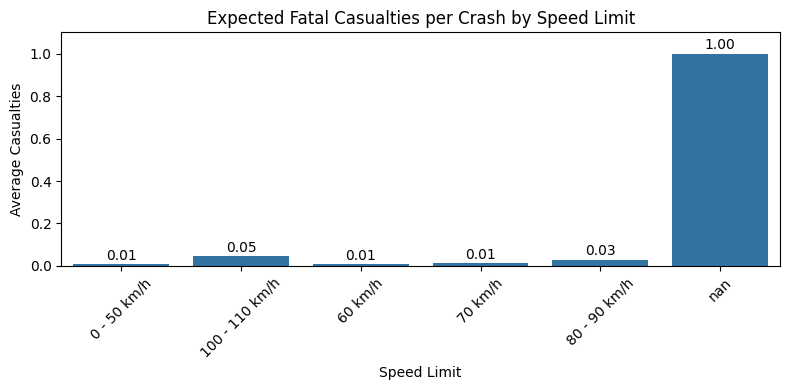
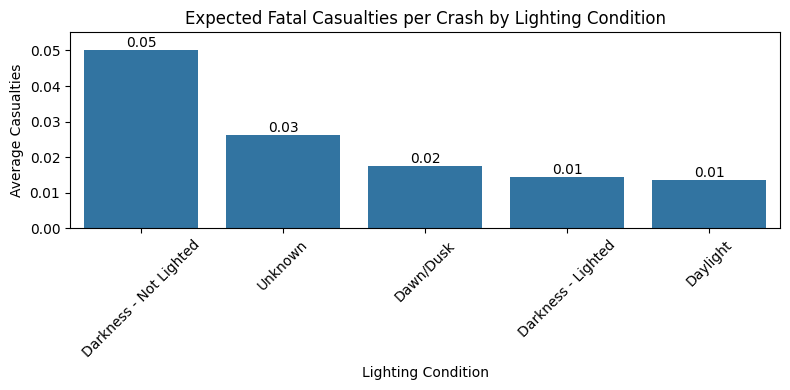
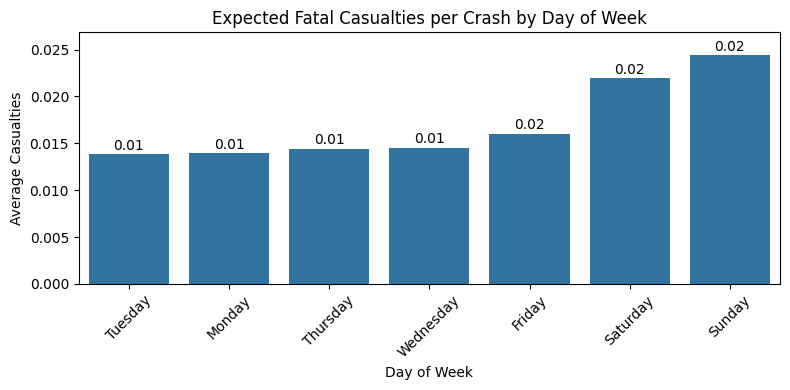
Speed & dark-unlighted conditions elevate severity → prioritize lighting & speed management.
Arterial corridor clustering (Brisbane City >3k) → infrastructure risk audits.
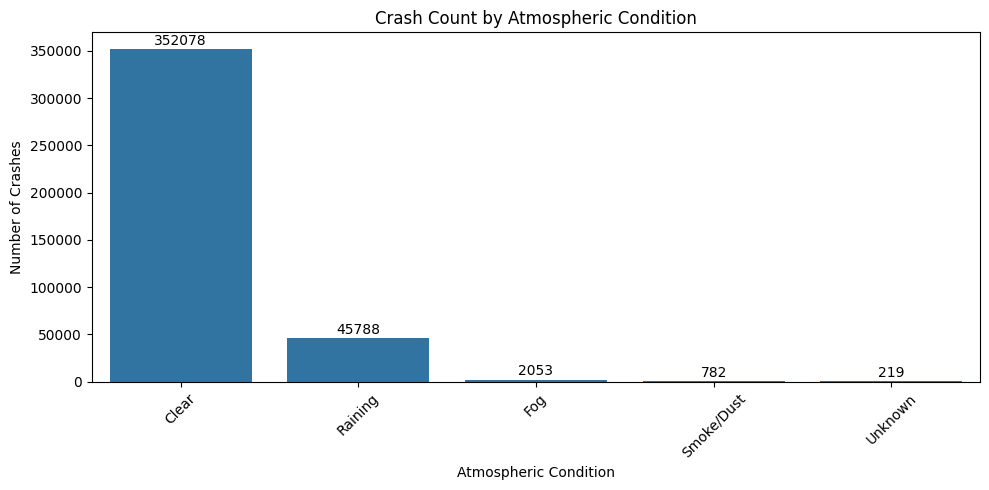
Clear weather dominates counts (exposure) → need rate normalization.
Daylight majority; dark-unlighted highest severity ratio → illumination upgrades.
Extended explanatory commentary (hypotheses, findings & insights) for each analysis without re‑embedding images. Refer to preceding sections for visual references.
Hypothesis: Mid/late week elevated. Finding: Friday highest; Sunday lowest. Insight: 47% differential → targeted Friday enforcement.
Southport & Brisbane City dominate; concentrating engineering & patrol resources in top decile suburbs yields outsized reduction potential.
March peak vs January trough (~20%) indicates seasonal exposure; schedule campaigns in late Q1.
~70% decline 2011→2024 signals systemic safety gains; monitor for plateau to avoid complacency.
15:00–18:00 weekday concentration; Friday 17:00 extreme peak → combine fatigue messaging + traffic flow optimization.
Steeper late‑week surges in commercial districts; tailored signal timing & variable speed signage recommended.
Higher posted speed & dark–unlighted environments elevate fatal expectation (3–4×) → prioritize lighting + speed management corridors.
Arterial & CBD lattice clusters justify infrastructure risk audits & corridor-level interventions.
Clear weather dominates absolute counts (exposure). Need traffic volume integration to interpret true relative risk under adverse conditions.
Dark–unlighted share smaller in volume yet disproportionately severe → LED retrofits & reflective surfacing high ROI.
Python ETL scripts, feature engineering & visualization notebooks available in the repository.
View on GitHub